🔗 Linked Evidence
Arcose Report 07
📄 HOLAND_CLAIM_FILE_p095 to p115 | p.101
📄 HOLAND_CLAIM_FILE_p095 to p115 | p.101
📝 Extracted Text (OCR)
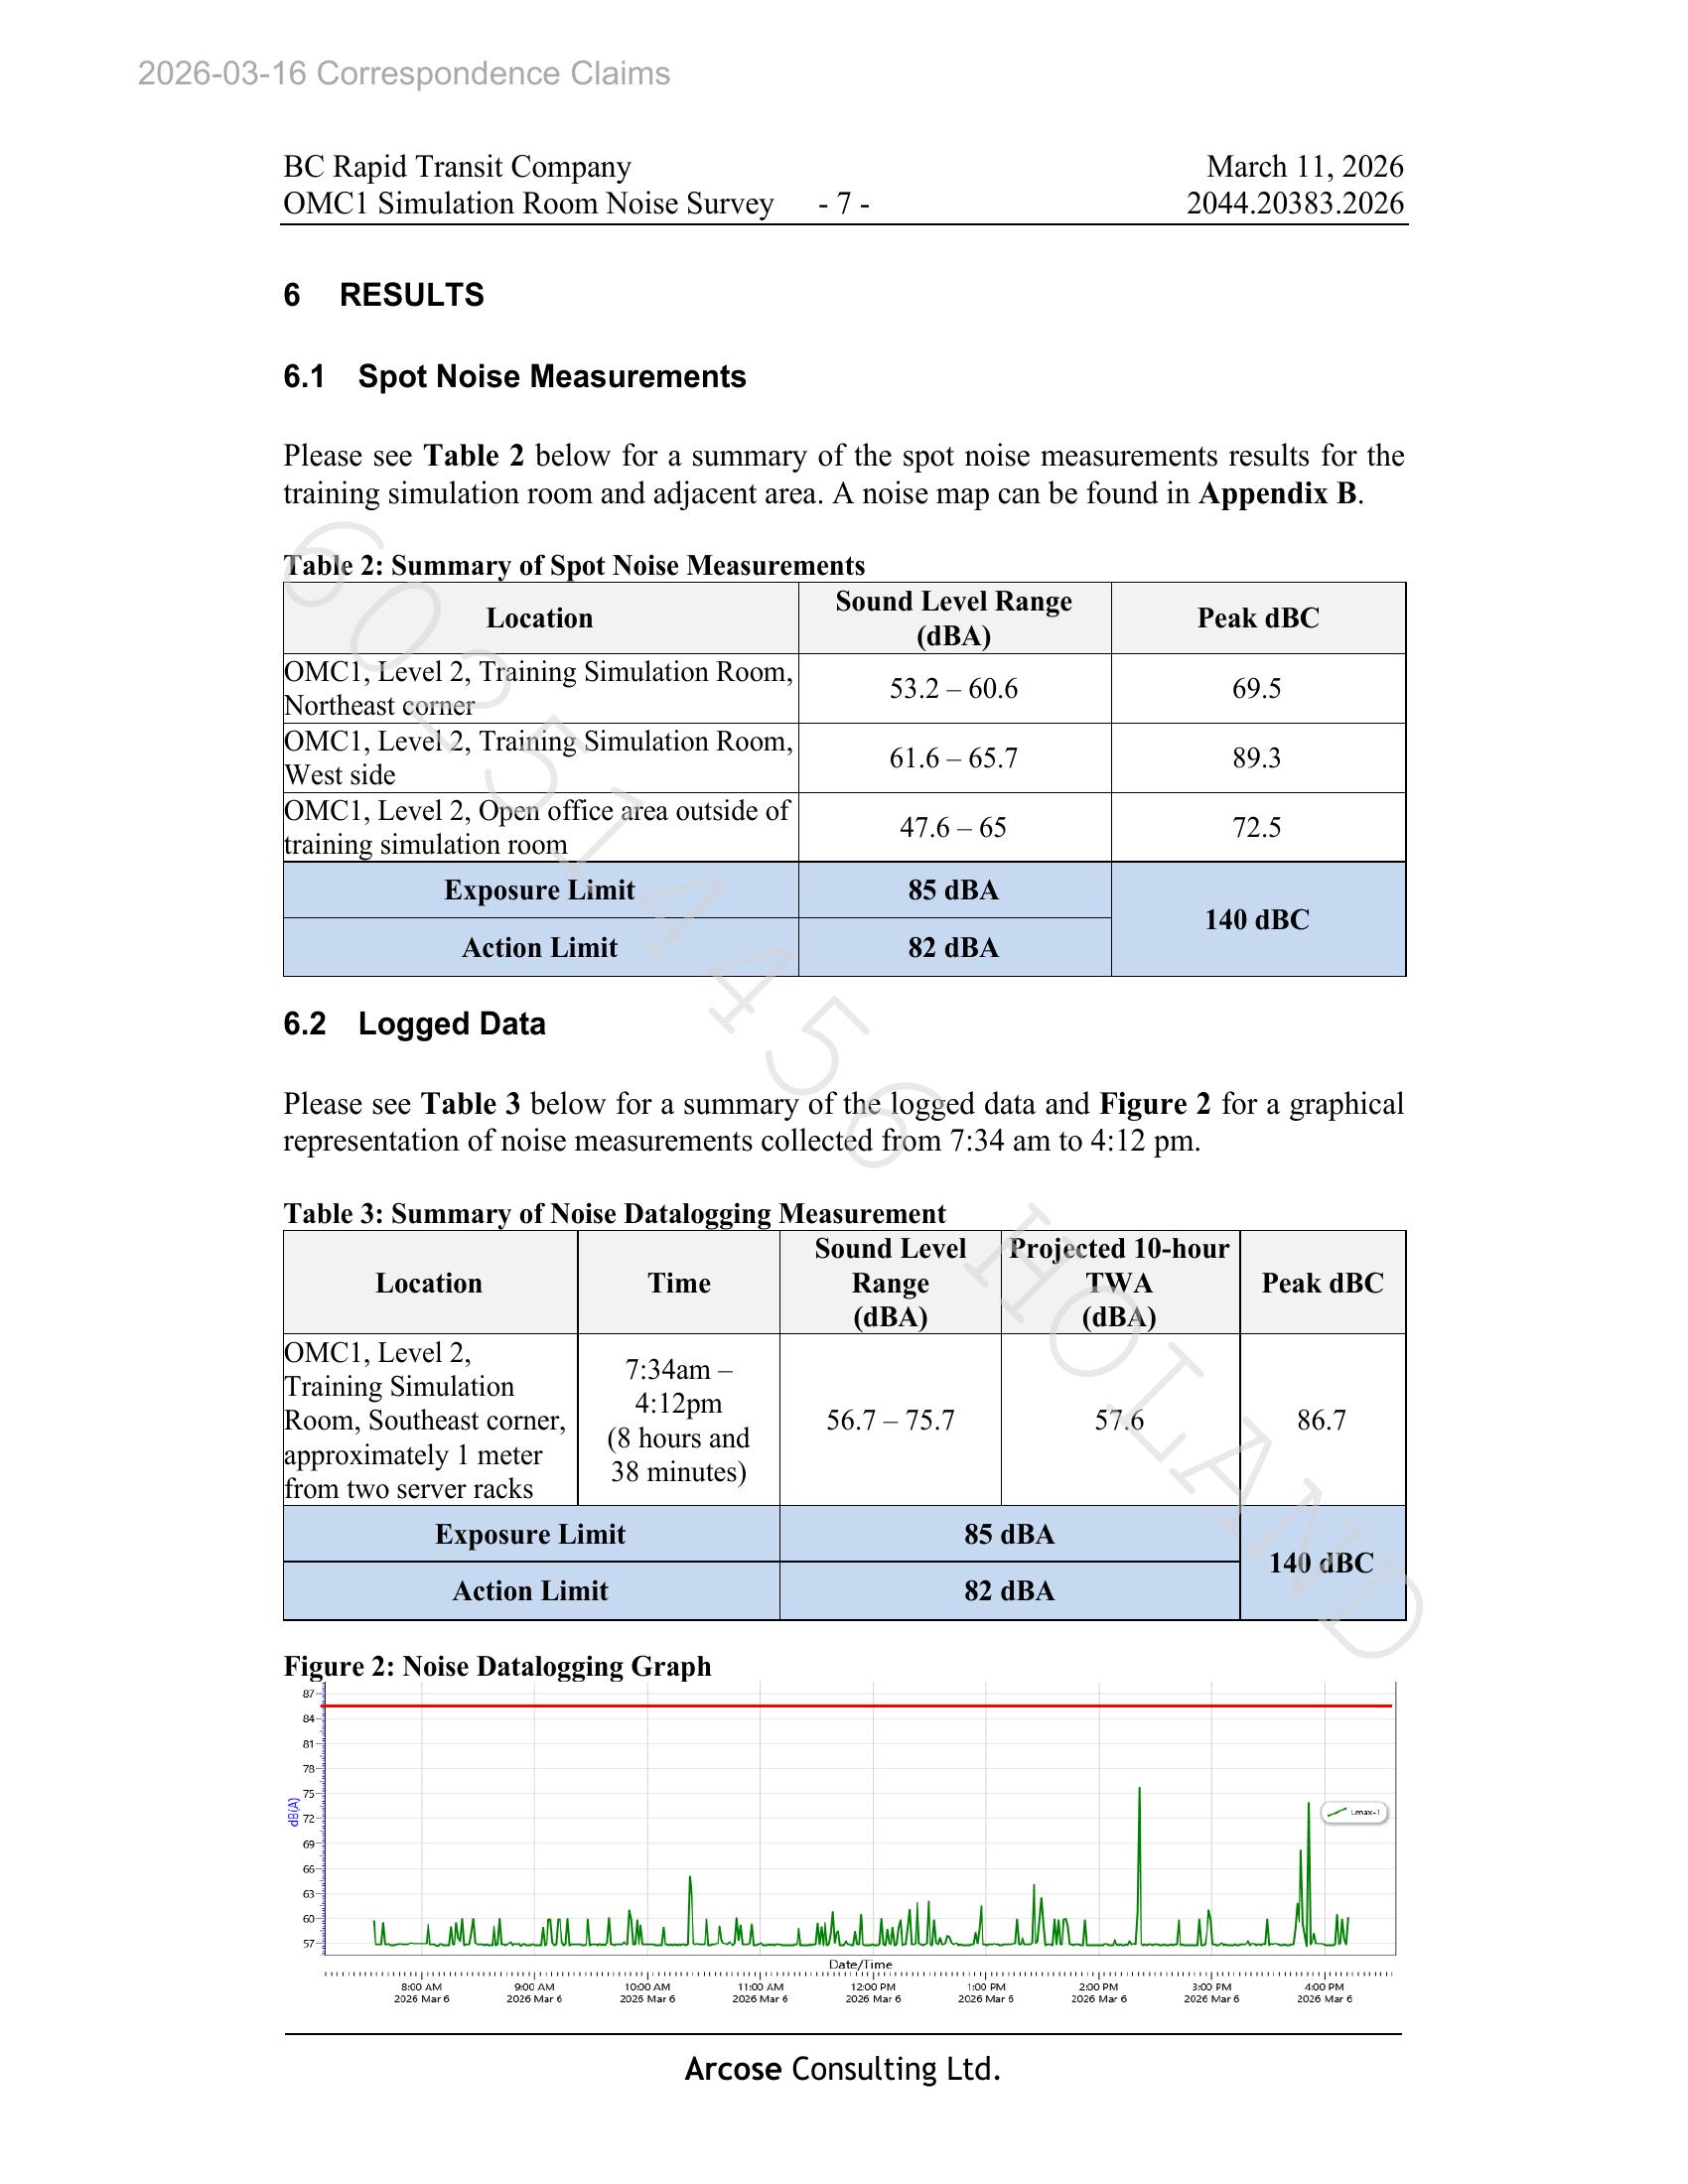
BC Rapid Transit Company March 11, 2026
OMCI Simulation Room Noise Survey _ - 7 - 2044.20383.2026

6 RESULTS
6.1 Spot Noise Measurements

Please see Table 2 below for a summary of the spot noise measurements results for the
training simulation room and adjacent area. A noise map can be found in Appendix B.

Table 2: Summary of Spot Noise Measurements

4 Sound Level Range
Location (dBA) Peak dBC

IOMCI, Level 2, Training Simulation Room, 53.2 60.6 69.5
Northeast corner
IOMC 1, Level 2, Training Simulation Room, 61.6 —65.7 893
[West side
OMC 1, Level 2, Open office area outside of 47.6 — 65 725
raining simulation room

Exposure Limit 85 dBA

140 dBC
Action Limit 82 dBA

6.2 Logged Data

Please see Table 3 below for a summary of the logged data and Figure 2 for a graphical
representation of noise measurements collected from 7:34 am to 4:12 pm.

Table 3: Summary of Noise Datalogging Measurement

Sound Level | Projected 10-hour
Location Time Range TWA Peak dBC
(dBA) (dBA)
OMCI, Level 2, : 7:34am —
(Training Simulation 4:12pm
IRoom, Southeast corner, “<P 56.7 — 75.7 57.6 86.7
. (8 hours and
approximately | meter :
38 minutes)
from two server racks
Exposure Limit 85 dBA
140 dBC
Action Limit 82 dBA

Figure 2: Noise Datalogging Graph

dB(A)

Date/Time

8:00 AM ‘900 AM 1090 AM 11:09 AM 1200 PM 1:00 PM 200 PM 3:00 PM 4.00PM
2025 Mar 6 2026 Mar 6 2026 Mar 6 2026 Mar 6 2026 Mar 6 2026 Mar 6 2026 Mar 6 2026 Mar 6 2026 Mar 6

Arcose Consulting Ltd.