FOI_Release_2026-143_p051
📄 FOI_Release_2026-143 | p.51
📄 FOI_Release_2026-143 | p.51
📝 Extracted Text (OCR)
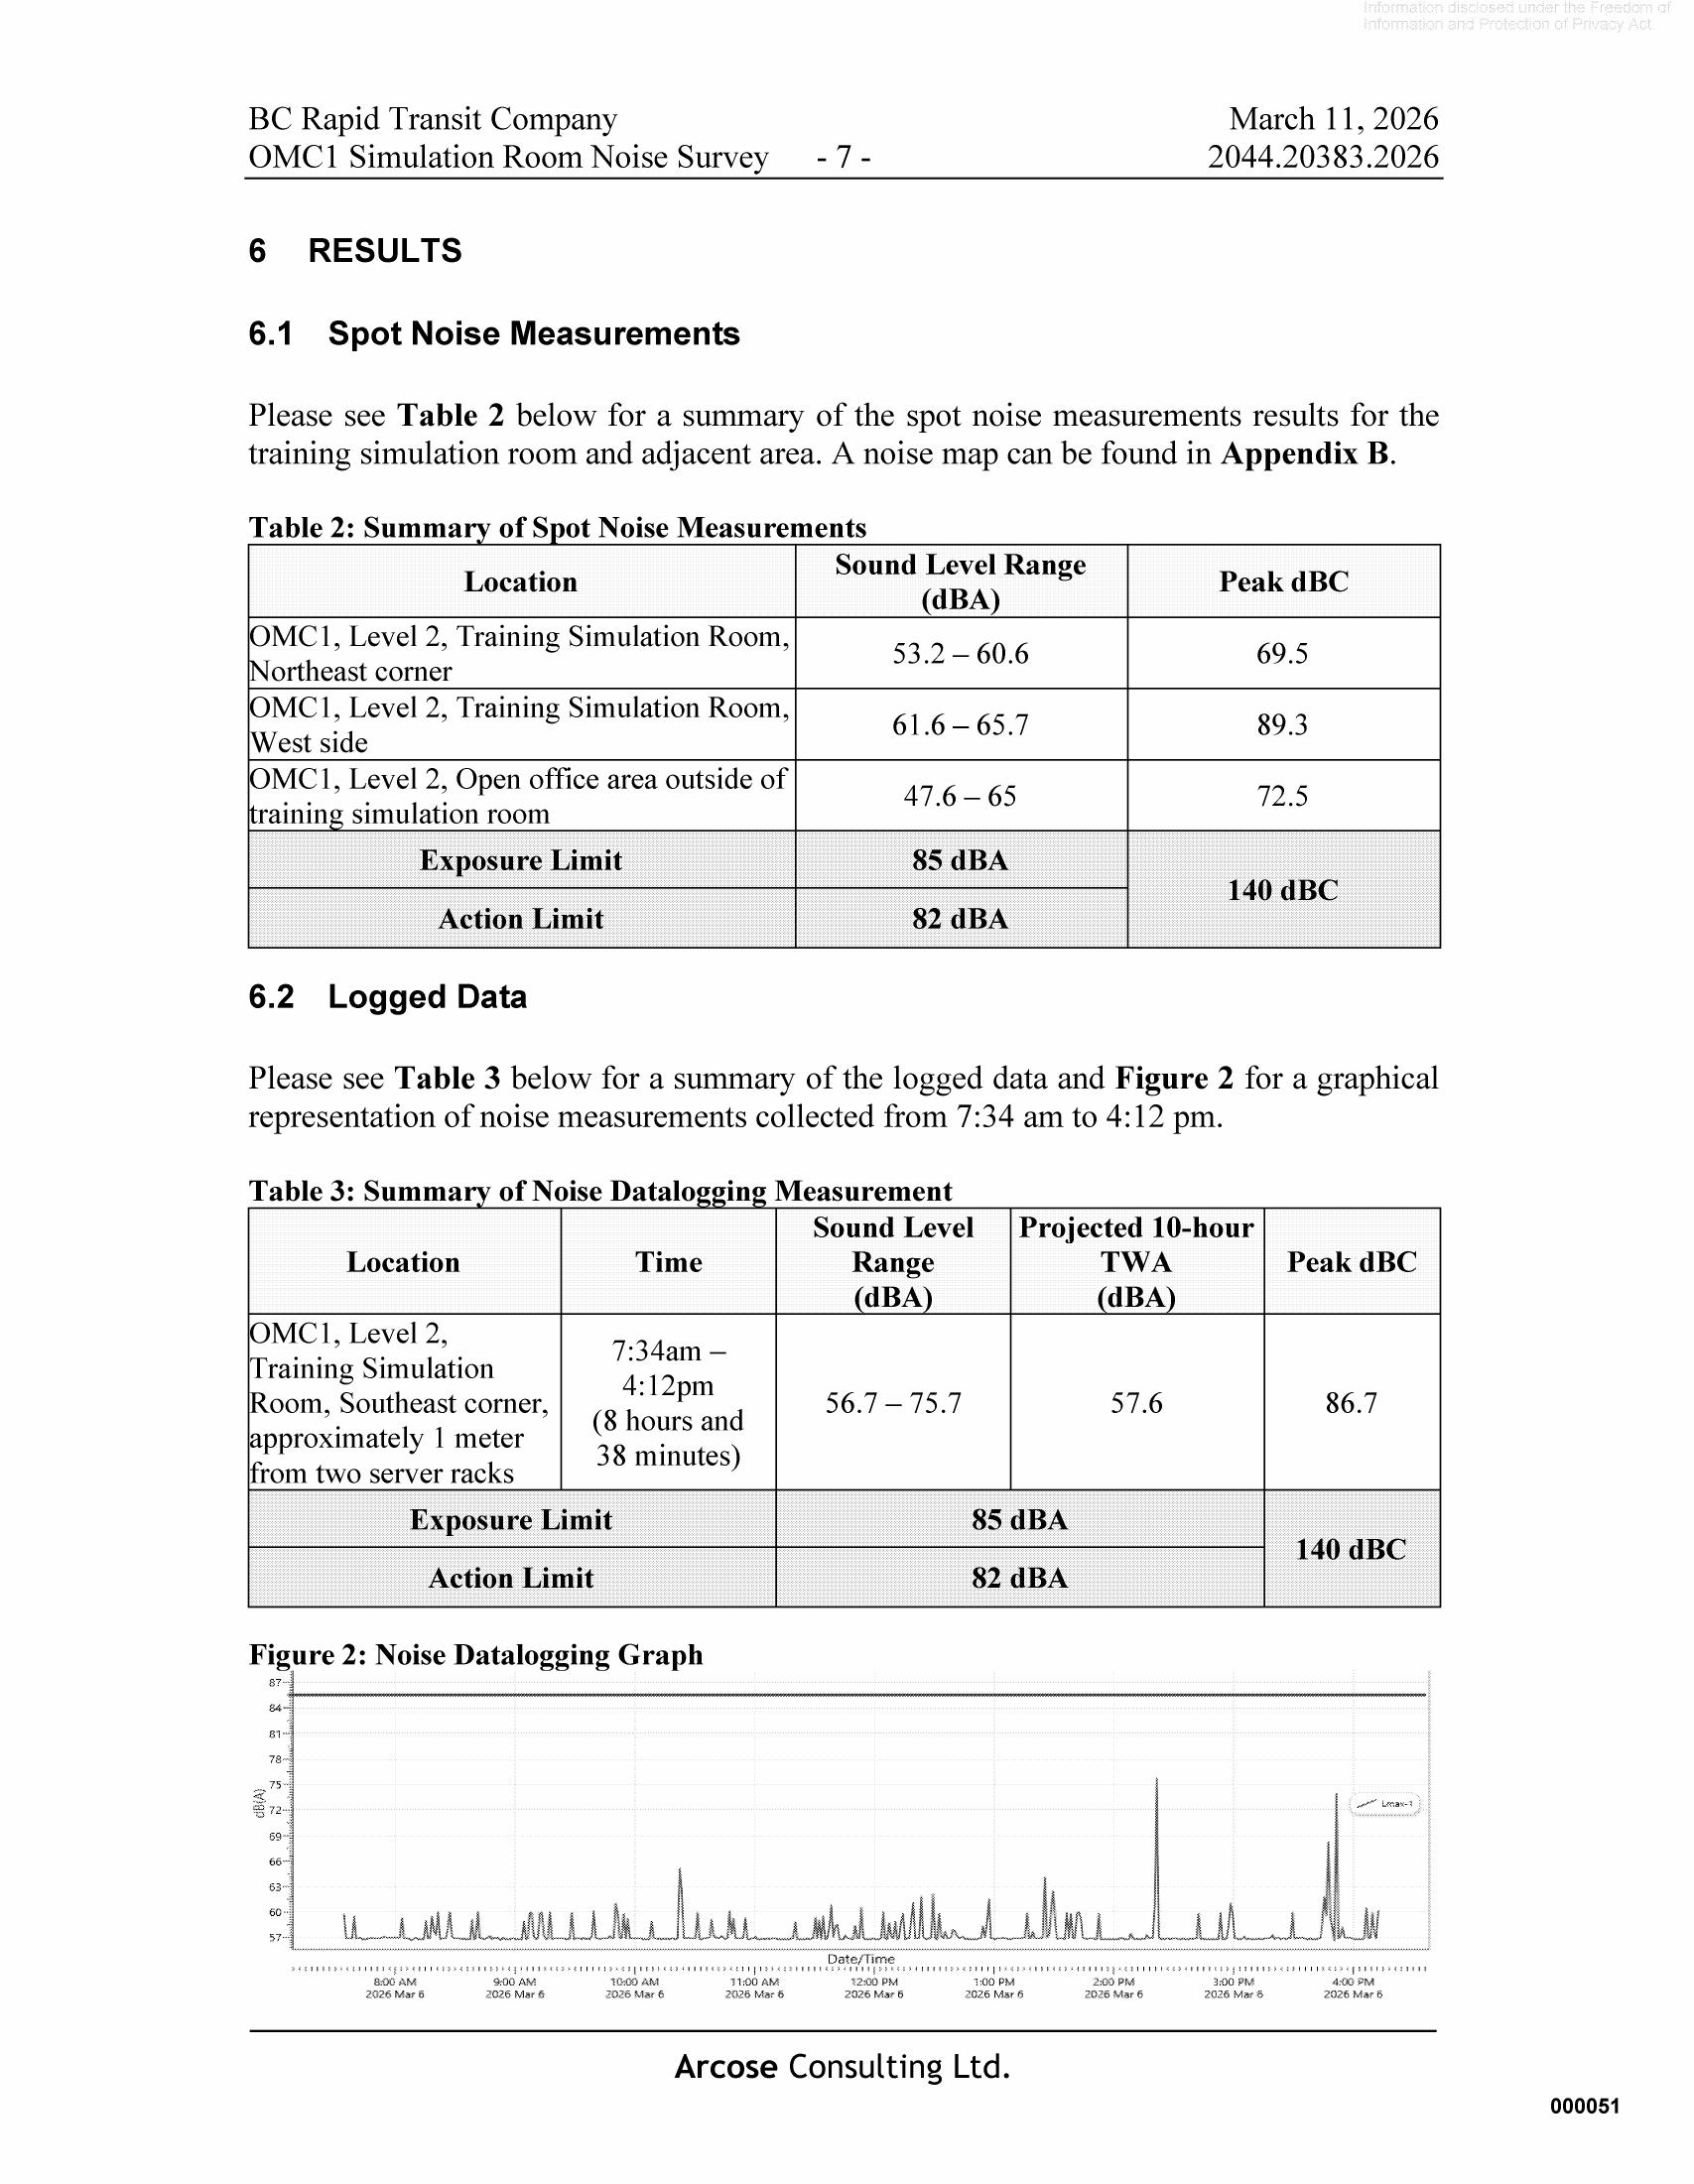
BC Rapid Transit Company March 11, 2026
OMC1 Simulation Room Noise Survey — - 7 - 2044.20383.2026

6 RESULTS
6.1 Spot Noise Measurements

Please see Table 2 below for a summary of the spot noise measurements results for the
training simulation room and adjacent area. A noise map can be found in Appendix B.

Table 2: Summary of Spot Noise Measurements

. Sound Level Range
Location (dBA) Peak dBC

IOMC1, Level 2, Training Simulation Room, 53.2 -60.6 69.5
Northeast corner
(OMC1, Level 2, Training Simulation Room, 61.6—65.7 893
West side
(OMC1, Level 2, Open office area outside of 41.6 —65 725
training simulation room

Exposure Limit 85 dBA

140 dBC
Action Limit 82 dBA

6.2 Logged Data

Please see Table 3 below for a summary of the logged data and Figure 2 for a graphical
representation of noise measurements collected from 7:34 am to 4:12 pm.

Table 3: Summary of Noise Datalogging Measurement

Sound Level |Projected 10-hour
Location Time Range TWA Peak dBC
(dBA) (dBA)
OMCI, ae 2, . 7:34am —
[Training Simulation A-12pm
Room, Southeast corner, “seP 56.7 — 75.7 57.6 86.7
. (8 hours and
approximately | meter ;
38 minutes)
from two server racks
Exposure Limit 85 dBA
140 dBC
Action Limit 82 dBA

Figure 2: Noise Datalogging Graph

‘ Low WEEN Mich calle an uh

Date/Time

i

800 AM 2:00 aXe 30:09 AM 71100 AM 32:00 PM +100 PM 2.00 Pd 3100 PM 405 90a
2026 Mar 6 2026 Mar 6 2026 Mar 6 2026 Mac 6 2026 Mar 6 2026 Mar 6 2026 Mar 6 2028 Mar 5 2026 Mar 5

Arcose Consulting Ltd.
000051